Creating an external Telegraf Plugin to push Pressure Stall Information (PSI) metrics to InfluxDB
I created an external Telegraf plugin to add Pressure Stall Information (PSI) metrics to InfluxDB.

A few weeks ago I worked on my first small Golang project. It is a telegraf plugin to gather the pressure stall information (PSI) metrics from Linux servers and push them to InfluxDB.
To learn more about PSI read the Facebook docs about PSI.
I might follow up with another post regarding the interpretation PSI metrics.
The development of the plugin was done for work during work time. I wanted to open source this small plugin so others do not need to spend the same time as I did on this again.
There already was a pull request open for the telegraf core for a similar functionality Add input plugin for PSI (Pressure Stall Information) #6760. But that pull request was stale for quite some time.
I did not want to bother the telegraf core maintainers with another pull request adding the PSI metrics. To make the work independent from the telegraf core I figured I can use external plugins for telegraf. That way everybody can add this plugin without changing the telegraf core. (I am not sure if the psi metrics should be in the telegraf core.)
After following the instructions for bootstrapping the plugin I searched for a way to get the metrics for:
/proc/pressure/cpu/proc/pressure/memory/proc/pressure/io
I checked the prometheus node-exporter projects because I know they are already getting the PSI metrics. And as it turns out the prometheus folks have written the procfs package:
This package provides functions to retrieve system, kernel, and process metrics from the pseudo-filesystems /proc and /sys.
Awesome, I do not need to parse the output myself. Less work and just one dependency.
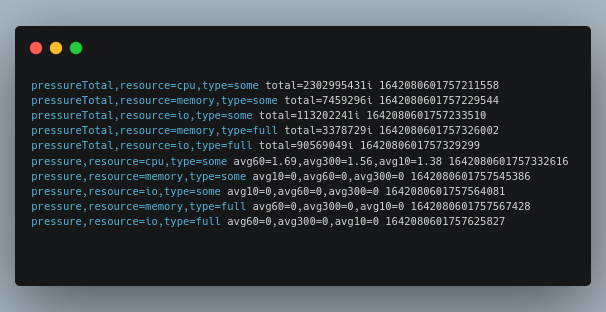
I also looked into the Influx documentation about how measurements with tags and fields. My approach is different than the original pull request I talked earlier about. I basically expose 2 metrics. pressure is added as a gauge and pressureTotal as a counter. Both values have tags for resource (either cpu, memory or io) and type (either some or full). This should not add too much cardinality to your InfluxDB if I understood everything correctly.
Now it was just me fiddling around with the interfaces from Telegraf, and voila the linux-psi-telegraf-plugin is working as expected!
 gridscale
This was my first real endeavor with Golang and I learned a lot. I am still a beginner and this was challenging, fun, and rewarding. It is not much code and relatively easy to understand. Just have a look yourself.
A thank you to gridscale and especially Felix (aka fkr) for allowing me to open source this small piece of code. The plugin is now under the gridscale GitHub account with the MIT license. So have fun!
I hope someone other than me can benefit from this plugin and does not need to reinvent the wheel again.
Have a great rest of your day!